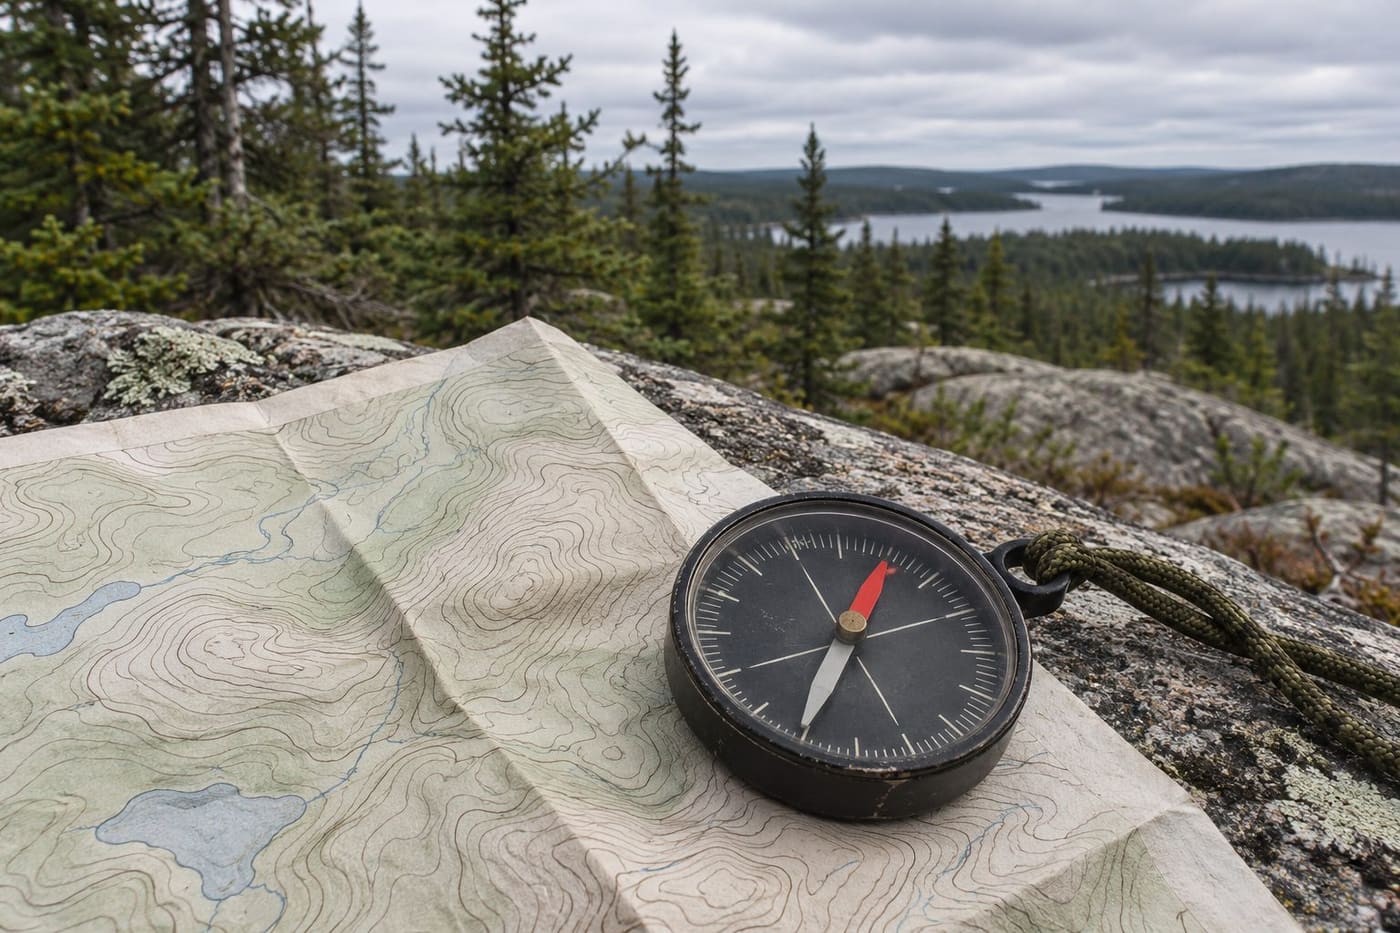
Two people lay compasses on two different Canadian topographic maps. Each needle settles. Each map has a north reference. Yet the angle between the needle and that reference can be different on the two sheets. Take either map out again years later and the original magnetic annotation may have aged, even though the direction to the geographic North Pole from the site is the same for the purposes of the comparison.
Magnetic declination explains the difference. It is the angle between true north and magnetic north at a particular location. It describes one aspect of a field that changes across the country and over time. To understand a declination value, ask where it applies, when it applies and what direction serves as zero. Those three questions help you read an old map margin, understand a field model and spot a sign error in a worked example.
A compass samples the magnetic field where it sits
True north is the direction towards the geographic North Pole along the local meridian. Magnetic north is the direction of the horizontal part of Earth's magnetic field at the observer's location. An ordinary compass held level can turn in that horizontal plane. It responds to the field around it, which is why a direction observed in one place cannot be assumed for another.
Imagine a breeze crossing a lake. A ribbon at the shore responds to the air moving past that point. A ribbon farther along the shore can show a different direction. The analogy is local response. A compass samples the direction of a magnetic field rather than moving air. As NOAA explains, the needle responds to the horizontal field at the compass, so the line along the needle is not a direct sightline to a single magnetic pole.
The full field also has a vertical component. Natural Resources Canada describes magnetic inclination as the angle between the field direction and the horizontal plane. Declination answers a different question about direction in the horizontal plane. A diagram that labels a declination in degrees and a table that lists field intensity are describing different properties. If you are comparing two locations, make sure you are reading the same property at both.
The distinction helps explain why a small compass can become less reliable in parts of the far north. The total field can still be substantial where its horizontal component is weak. An angle measured from that weak horizontal component can be more sensitive to disturbances. NOAA describes zones where magnetic compass accuracy is severely degraded. A number returned by a model in such an area should be read with the model's limitations in view.
Why the angle differs across the country
Think of true north as a local reference direction, defined by the geographic meridian. The horizontal magnetic field can lean east or west of that direction. If it leans east, declination is east, often written as a positive number. If it leans west, declination is west, often written as a negative number. Where the two directions line up, declination is zero.
The magnetic field changes across political borders just as it does within them. A map that colours regions by declination can show broad patterns, but an estimate still belongs to coordinates. Moving from one part of Canada to another changes the place where you sample the field. It also changes the meridian used as the true-north reference. A value that happens to be close to zero at one site tells you little about the sign or size at another.
On a declination chart, contours can link places with the same estimated angle. Read the labels on those contours before deciding whether the field points east or west of true north. A location between two contours may have a value between their labels in the model represented by the chart. That makes a chart a way to visualise the pattern, and the chart's date remains part of the evidence.
Latitude alone cannot supply the answer. Two sites on the same parallel can have different declination values. Nor does knowing a site's distance from a magnetic pole produce the angle on its own. A usable comparison keeps the full location, reference and date together. For example, if a class compares a coastal city with an inland city, record both coordinates and use the same date and model before interpreting the difference.
Why the angle changes with time
Natural Resources Canada calls the longer-term evolution of the field secular variation. An annotation printed on a sheet describes a value for an indicated time. Some Canadian topographic sheets also give an annual change. That figure can help interpret the annotation near its reference year. Extending a fixed annual change far beyond that year assumes the rate holds steady, which Natural Resources Canada cautions against for old maps.
For a fictional illustration, suppose a chart lists 8 degrees east and an annual decrease of 6 arcminutes. There are 60 arcminutes in a degree. Under a constant-rate assumption, five years would give a decrease of 30 arcminutes, or half a degree, bringing the value to 7 degrees 30 minutes east. The arithmetic shows what the note means. It does not establish that the real field followed that rate for the whole period. Use a model appropriate to the date when making a fresh comparison.
Secular variation also differs from shorter disturbances. Natural Resources Canada describes variations that can become more irregular during magnetic storms and where the horizontal field is weak. A time-dependent model of the main field gives a reference estimate. A compass observation at a particular moment can also be affected by short-term changes and nearby magnetic influences. The model estimate and the observation can therefore differ even when you entered the coordinates correctly.
In an educational comparison, you might look up the same coordinates twice, with different dates supported by the same model. That isolates time as the input you intentionally changed. To compare locations, hold the date fixed and change the coordinates. If the calculator selects a different model for older dates, write that down. A table that combines results without the model names makes it harder to know how much of the difference comes from the comparison you meant to make. Keep the coordinate signs too. Accidentally entering a west longitude as east could give you a plausible angle from a completely different part of the globe.
Read all three north references on a topographic sheet
A Canadian topographic sheet may show true north, grid north and magnetic north in its margin. Grid north follows the map's printed coordinate grid. True north follows the geographic meridian. The angle between those two directions is often called grid convergence. Magnetic north represents the horizontal field direction. These three lines can differ even when they are drawn on the same small diagram.
Natural Resources Canada explains that the angle shown between the grid and magnetic directions on a Canadian topographic sheet is properly called grid declination. If a model gives the angle between magnetic and true north, that number cannot automatically be substituted for the grid angle. First see which pair the map annotation connects. A small star, arrow or grid symbol means what its own map legend says it means. Use the legend and the stated reference year, particularly when comparing sheets printed at different times.
Here is a fictional geometry exercise. Take true north as zero. Suppose grid north is 2 degrees east of it and magnetic north is 8 degrees east of it. Both angles are measured from the same reference, so the magnetic direction is 6 degrees east of grid north. If grid north were instead 2 degrees west, the separation between grid and magnetic north would be 10 degrees. Drawing three rays from one point makes both results easier to see.
Pay attention to where a map annotation applies. Natural Resources Canada's example shows how the margin can give different declination values for different parts of a sheet. A neatly drawn diagram at the edge of a map can still represent an approximate geometry at stated points and dates. The value isn't a property of the paper itself. It describes a relationship between directions at a place represented by the paper.
Check the sign with a simple bearing exercise
A bearing measures an angle clockwise from the north reference you name. When a bearing is measured from magnetic north and the declination is defined east-positive and west-negative from true north, NOAA gives the conversion to a true bearing by adding the signed declination. Use that rule only after confirming the source angle is the true-to-magnetic one.
Imagine a fictional target with a magnetic bearing of 70 degrees. At the fictional site, magnetic north lies 8 degrees east of true north. Starting from true north, you turn 8 degrees clockwise to reach the magnetic reference and then another 70 degrees to reach the target. The true bearing is 78 degrees. If the magnetic reference were 8 degrees west, add negative 8 degrees instead, giving 62 degrees. The target bearing in each example is computed from the stated geometry rather than taken from a real location.
The transition past north also tests the arithmetic. A magnetic bearing of 355 degrees with an east declination of 8 degrees gives 363 degrees before normalising to one turn. Subtract 360 and the true bearing is 3 degrees. In the other direction, a result of negative 3 degrees can be written as 357 degrees. The direction stays the same after adding or subtracting a whole turn.
Check the conversion by reversing it. For the first example, 78 degrees true minus the positive 8-degree declination takes you back to 70 degrees magnetic. If a map uses grid north, name the bearing as a grid bearing and handle that reference separately. Keep the units visible too. An annotation of 8 degrees 30 minutes means 8.5 degrees, not 8.30 decimal degrees. Those notations look similar and can produce different results if entered without conversion.
Record an estimate so someone else can check it
Geomagnetism Canada links to material on observatories, magnetic plots and calculators. A field model represents observations mathematically and estimates the field for specified inputs. It can show how the expected angle changes between places or dates. A person holding a compass observes the local field and any influences near the instrument. The model and the reading answer complementary questions.
For a classroom comparison, record the location, coordinate format, date, model name, angle and sign convention. Preserve the output's own labels for units and reference direction. If you turn an east-west label into a signed number for a calculation, record both forms. A row that says only “8” leaves the next reader to guess the units, sign and north reference. An extra column for limitations can identify a near-pole estimate or a date at the edge of the model's range.
If a compass demonstration looks inconsistent, repeat it away from obvious metal objects, magnets and electronics. Keep the compass level, allow the needle to settle and check what line you used for the comparison. A careful observation can illustrate the local field, but a desk demonstration doesn't establish the accuracy of a particular model or the suitability of an instrument for a trip. The first-course orienteering guide covers a different activity with its own map and event conventions.
When comparing a historical map with a current estimate, put the old diagram beside the model output and write down what each one actually reports. One might be an angle from grid north printed for an earlier year. The other might be an angle from true north estimated for the present date. Separate the difference in reference from the difference in time before drawing a conclusion. Once you can name the location, date and two directions, the changing number becomes a readable description of Earth's field rather than a contradiction between two arrows.
Sources consulted 7 November 2026
- Natural Resources Canada guide to magnetic declination
- Natural Resources Canada overview of magnetic reference field models
- NOAA geomagnetism frequently asked questions
- NOAA magnetic declination and bearing conversion