A forecast of aircraft demand can sound like an announcement of aircraft orders. The difference matters: one is an estimate of future needs, while the other records purchasing commitments. Airbus’s newly released cargo outlook offers a useful opportunity to practise reading those distinctions.
The company projects a larger freighter fleet by 2045. To understand the announcement, readers need to separate the aircraft arriving from the aircraft retiring, and then distinguish both from the amount of cargo transported. This guide uses the published figures to explain that accounting, including two small discrepancies that should be disclosed rather than explained away.
What Airbus actually forecast
Airbus published its 2026 Cargo Global Market Forecast on 21 October 2026. Its press release says the global dedicated freighter fleet is projected to increase from 2,360 aircraft in 2025 to 3,460 in 2045. The difference is 1,100 aircraft. Dividing 1,100 by the starting fleet of 2,360 gives about 46.6%. That would round to 47% to the nearest whole percentage point, rather than the 46% stated by Airbus. The published endpoints do not reproduce the headline exactly; this article retains the company’s stated percentage as an attributed forecast, not as a separately verified arithmetic result.
The company separately estimates a requirement for 2,670 new freighter deliveries over the same period:
- 1,580 aircraft for replacement: aircraft entering service to replace older freighters that leave the fleet.
- 1,090 aircraft for growth: aircraft added to serve an expanded fleet.
- 2,670 total deliveries: the replacement and growth components added together.
This distinction is central. A fleet can receive more deliveries than its net size increase because some deliveries replace aircraft that retire. If a fleet begins with 2,360 aircraft and grows by a net 1,100, the remaining 1,570 or so of the 2,670 deliveries do not appear as extra aircraft in the final fleet total: they replace aircraft leaving service. Airbus’s stated replacement number is 1,580, which differs by ten aircraft from that simple subtraction. The fleet chart also displays 790 aircraft staying in service: 790 plus 2,670 equals the 3,460 final fleet, while 790 plus 1,580 equals 2,370 rather than the stated 2,360 starting fleet. The published chart does not explain that discrepancy. Rounding is a possible explanation, but it should not be asserted as an established fact.
Think of a household replacing an old car while also buying another car for a new driver. The number of purchases is greater than the change in the number of cars owned. Aircraft forecasts work similarly: deliveries, retirements and the size of the active fleet are related measures, but they are not interchangeable.
New-build aircraft versus passenger-to-freighter conversions
Airbus divides the 2,670 aircraft requirement by how the aircraft would enter freighter service. It projects 970 new-build freighters and 1,700 conversions of passenger aircraft. In other words, the forecast does not describe a future fleet made entirely of fresh production freighters. Conversions make up roughly 64% of the projected requirement, while new-build aircraft account for about 36%.
A passenger-to-freighter conversion takes an aircraft designed for passengers and modifies it for cargo operations. The exact work depends on the aircraft and conversion programme, but the broad change is from a cabin with passenger seating and passenger-service systems to a cargo configuration that can load, secure and carry freight. Airbus’s technical discussion of the A321P2F describes structural and system changes and a Supplemental Type Certificate process. Conversion is not simply removing seats and declaring a passenger jet a freighter.
New-build and converted aircraft can serve different needs. A new design may offer operators a newer platform or features intended for cargo missions. A conversion can extend the working life of an aircraft that no longer has the right economics or role in passenger service. The right choice depends on factors such as acquisition and modification cost, maintenance, payload, range, fuel use, route structure, aircraft availability and the operator’s financing.
Those are general decision factors, not a claim that Airbus’s forecast assigns a specific business case to every aircraft. The press release gives fleet totals and broad aircraft-size categories, while the full forecast report contains the detailed market analysis. Readers should not infer an airline’s procurement plan from the global conversion estimate.
Why the forecast separates aircraft by size
The forecast report’s aircraft-size chart lists 1,140 small freighters, 860 mid-size widebodies and 670 large widebodies. These categories signal that cargo demand is not a single uniform market. Operators need aircraft suited to different volumes, route lengths, airport constraints and schedules.
For example, a regional or shorter-haul operation may value a smaller aircraft that can serve a network of destinations. A long-distance cargo route may require a larger aircraft with different range and capacity characteristics. This is an illustrative comparison, not a claim about a named airline or a specific route. Aircraft size alone does not determine whether a route is profitable: load factors, fuel, crew, maintenance, airport access, handling and competing transport options also matter.
The categories are useful because they prevent a reader from imagining that every addition to the fleet means the same thing. The report’s small-freighter category is larger than its large-widebody category by aircraft count, while the large category may have a different carrying role per plane. A total number of aircraft does not reveal total cargo capacity unless the forecast also explains payload assumptions and how capacity is measured.
That is a general lesson for reading industry projections: ask whether the unit is aircraft, available capacity, cargo tonnes, tonne-kilometres, revenue or traffic. A percentage increase in one measure should not be repeated as though it applies to another.
Fleet growth is not cargo-traffic growth
The report projects air-cargo traffic growth of 3.2% annually over 2025–2045. This is a separate measure from the stated 46% fleet-size increase. One figure is a cumulative change in the number of freighters between two endpoints; another is an annual compound growth rate for traffic.
An annual compound growth rate means the value is assumed to increase by a percentage each year, with each year’s growth applying to the prior year’s level. It is not the same as adding 3.2 percentage points to the 2025 fleet each year. Nor does it mean each calendar year will actually produce exactly that change. Forecasts smooth a future path into a planning rate; real demand can rise, flatten or fall from year to year.
Air cargo traffic can also be measured in different ways. A shipment’s weight is not the same as the distance it travels. A small high-value component flown across a continent may contribute differently to traffic measures than a heavier shipment moving a shorter distance. When comparing two industry reports, readers should check the definition and unit rather than compare percentages at face value.
What could change the projection
Long-range forecasts are planning tools, not promises. A useful review asks what would need to remain true for a projection to hold. Consider the following questions when testing a forecast rather than treating its endpoint as inevitable:
- Trade patterns: new tariffs, trade agreements, manufacturing locations or economic slowdowns can shift routes and shipment volumes.
- Passenger-aircraft supply: conversion programmes depend partly on suitable aircraft becoming available at viable ages and prices.
- Fuel and operating costs: changes in fuel prices and efficiency can alter the economics of air versus sea, rail or road transport.
- Technology and regulation: aircraft, engines, fuels, emissions rules and airport requirements may evolve over two decades.
- E-commerce and customer expectations: faster delivery can support air freight for some products, but cost-sensitive goods may use slower transport.
- Capacity utilisation: a fleet can carry more or less cargo depending on scheduling, loading, network design and operational disruption.
- Competition and substitution: other modes can take freight where time, cost and reliability make them suitable.
These are variables to consider, not predictions that any one outcome will occur. Airbus’s forecast is published by an aircraft manufacturer with a commercial interest in the aviation market. That does not make the figures invalid; it does mean readers should identify the source and compare the methodology and assumptions with other independent forecasts before treating the projection as consensus.
A five-step reader’s checklist
When you encounter a headline about freighter demand, use this checklist:
1. Identify the measure. Is the claim about active fleet size, annual deliveries, cargo capacity, traffic, or market revenue?
2. Check the endpoints. A percentage increase depends on the starting and ending years. Airbus’s fleet comparison is 2025 to 2045.
3. Separate replacement from expansion. Deliveries can be high even when the net fleet increase is smaller, because aircraft retire.
4. Look at the fleet mix. New-build aircraft and conversions are different routes into service, and smaller aircraft and widebodies are not one-for-one substitutes.
5. Read the source’s incentives and limits. A manufacturer can provide valuable industry data, while an independent comparison helps show whether the result is broadly shared.
You can apply the same checklist to other sectors. A forecast of power-plant additions is different from net installed capacity if older plants close; a forecast of vehicle sales differs from the number of vehicles on the road if retirements are substantial. The useful question is often not “How large is the headline?” but “Which flows produce the final stock?”
What the figures do not tell you
The press release does not identify every future operator, route, aircraft registration or delivery date. It does not establish that all projected aircraft will be ordered, financed, delivered on schedule or operated at full utilisation. It does not provide a guaranteed forecast for prices, airline profits or the future cost of shipping a parcel. Those questions require other data and, in some cases, cannot be known this far ahead.
The distinction matters to consumers and businesses. A bigger freighter fleet could support capacity, but it does not automatically mean lower shipping prices or faster delivery. Costs can be affected by fuel, labour, handling, customs, airport capacity, demand peaks, route availability and contracts. An additional aircraft in a global fleet may not serve the lane a particular shipper needs.
Nor does the fleet forecast alone settle environmental questions. An environmental comparison would depend on what aircraft are replaced, how intensively aircraft fly, the energy used, the cargo carried and the accounting boundary. A claim about per-aircraft efficiency is not the same as a claim about total sector emissions. For an environmental assessment, readers need a transparent baseline and comparable emissions data rather than a fleet count alone.
A worked example with invented numbers
Suppose an imaginary operator starts with 100 freighters. Its planning team expects to withdraw 30 and introduce 50 during a chosen period. Its ending fleet would be 120: the starting 100, minus 30 withdrawals, plus 50 additions. Deliveries equal half the starting fleet, but net fleet growth is only one fifth. Calling the plan “50% fleet growth” would confuse an incoming flow with the final change in stock.
Now suppose 35 of those incoming aircraft are converted passenger jets and 15 are newly manufactured freighters. There are still 50 additions to this operator’s freighter fleet. The conversion share does not create another 35 aircraft on top of that number. A spreadsheet that adds deliveries and conversions as separate totals would double-count aircraft already included in the delivery requirement.
Next, imagine the team delays ten withdrawals while keeping all arrivals unchanged. The ending fleet becomes 130. That larger fleet does not by itself demonstrate stronger demand: it could simply reflect a different retirement decision. Alternatively, suppose ten arrivals are delayed and the original withdrawals proceed. The ending fleet becomes 110. That smaller fleet does not, by itself, prove customers abandoned air freight. Capacity and demand should be examined separately.
These are invented arithmetic examples, not Airbus scenarios or predictions about any airline. Their purpose is to show why a forecast should be read as a set of linked quantities. When a number changes, ask which component changed before deciding what the revision means.
For a practical comparison sheet, make one row for each forecast edition and keep the following fields distinct:
- Publication date and starting year.
- Definition of the fleet being counted.
- Starting fleet, additions, withdrawals and ending fleet.
- Conversion share within additions, if provided.
- Traffic measure and forecast horizon.
- Any difference between the displayed totals and their arithmetic reconciliation.
Leave a field blank when the source does not provide it. A blank is more useful than an invented assumption because it tells the next reader what still needs checking. If a calculation uses a simplifying assumption, put that assumption beside the formula rather than hiding it in a distant note.
Conclusion
The useful reading of this forecast is an accounting exercise before it is a growth story. Identify the quantities, check whether they add up, and preserve the distinction between a manufacturer’s projection and actual purchasing activity. Where displayed numbers differ, report the discrepancy without inventing its cause. Those habits make the outlook easier to compare with later evidence and prevent a forecast headline from becoming an unsupported claim about orders, prices or delivery guarantees.
Sources and research note
Research checked 25 October 2026 (Asia/Dhaka). Sources:
- [Airbus cargo forecast announcement, 21 October 2026](https://www.airbus.com/en/newsroom/press-releases/2026-10-airbus-projects-global-freighter-fleet-to-grow-by-2045): headline, fleet and delivery estimates and conversion mix.
- [Freighter Global Market Forecast 2026](https://mediaassets.airbus.com/pm_38_941_941532-631bgsfuib.pdf?fileName=freighter-global-market-forecast-2026.pdf): fleet reconciliation, size categories and traffic outlook. Calculations and invented examples in this article are editorial analysis, not additional company forecasts.
- [Airbus technical discussion of passenger-to-freighter conversion](https://www.aircraft.airbus.com/en/newsroom/news/2021-03-passenger-to-freighter-conversions): conversion work and certification context; not a new 2026 programme announcement.
Discovery came from the saved Germany Google Trends snapshot of 25 October, where Airbus was listed. This is a global forecast, not a Germany-only outlook. The earlier snapshot is a dated discovery record, not evidence of current search rank.
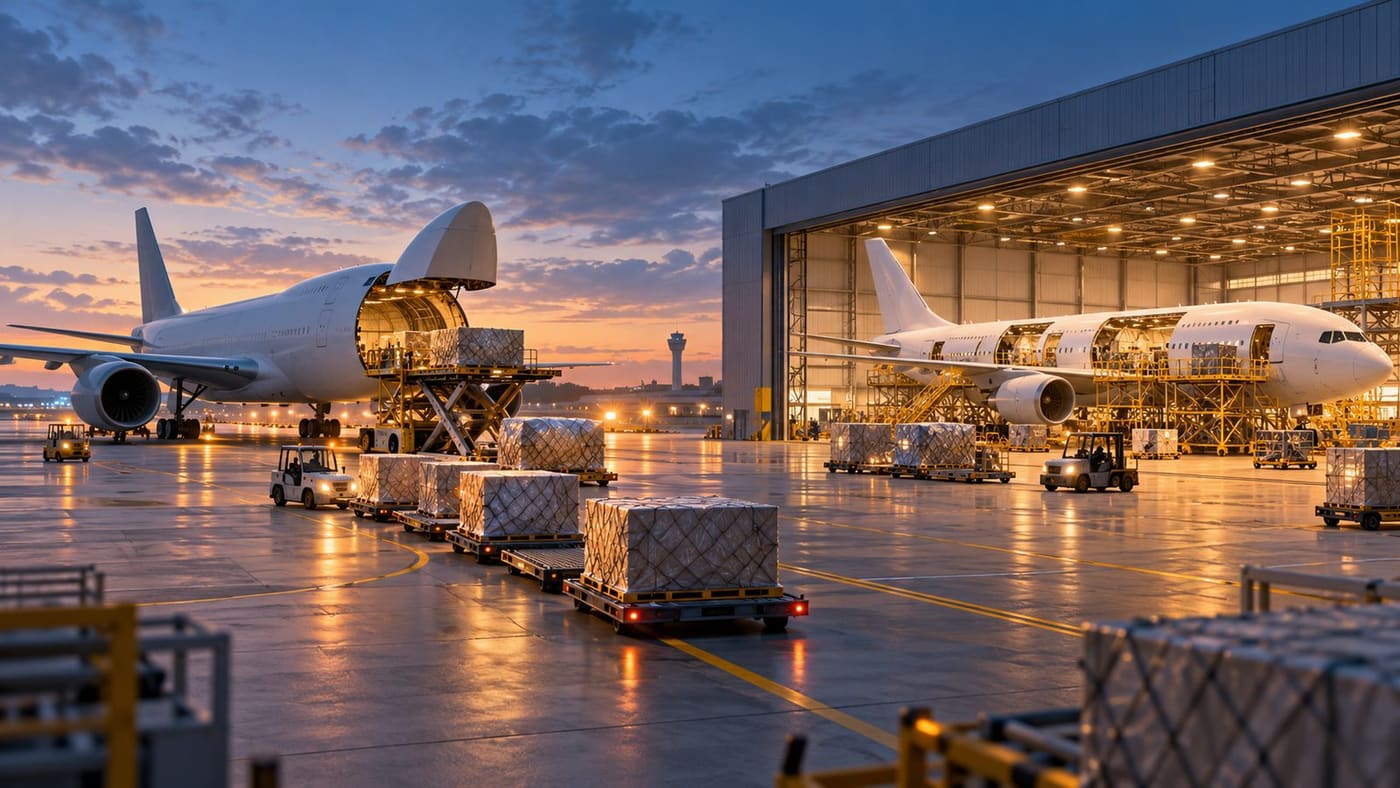
Limited similarity review used two targeted searches for distinctive wording around Airbus’s 2045 freighter forecast and fleet-versus-delivery distinction. The angle here is explanatory: reconciling fleet stock, replacements, growth and conversion shares. This is not a comprehensive plagiarism scan or a uniqueness guarantee. The original built-in AI-generated illustration depicts an imagined cargo apron and conversion hangar; it is not a photograph, Airbus facility, or identified aircraft model.