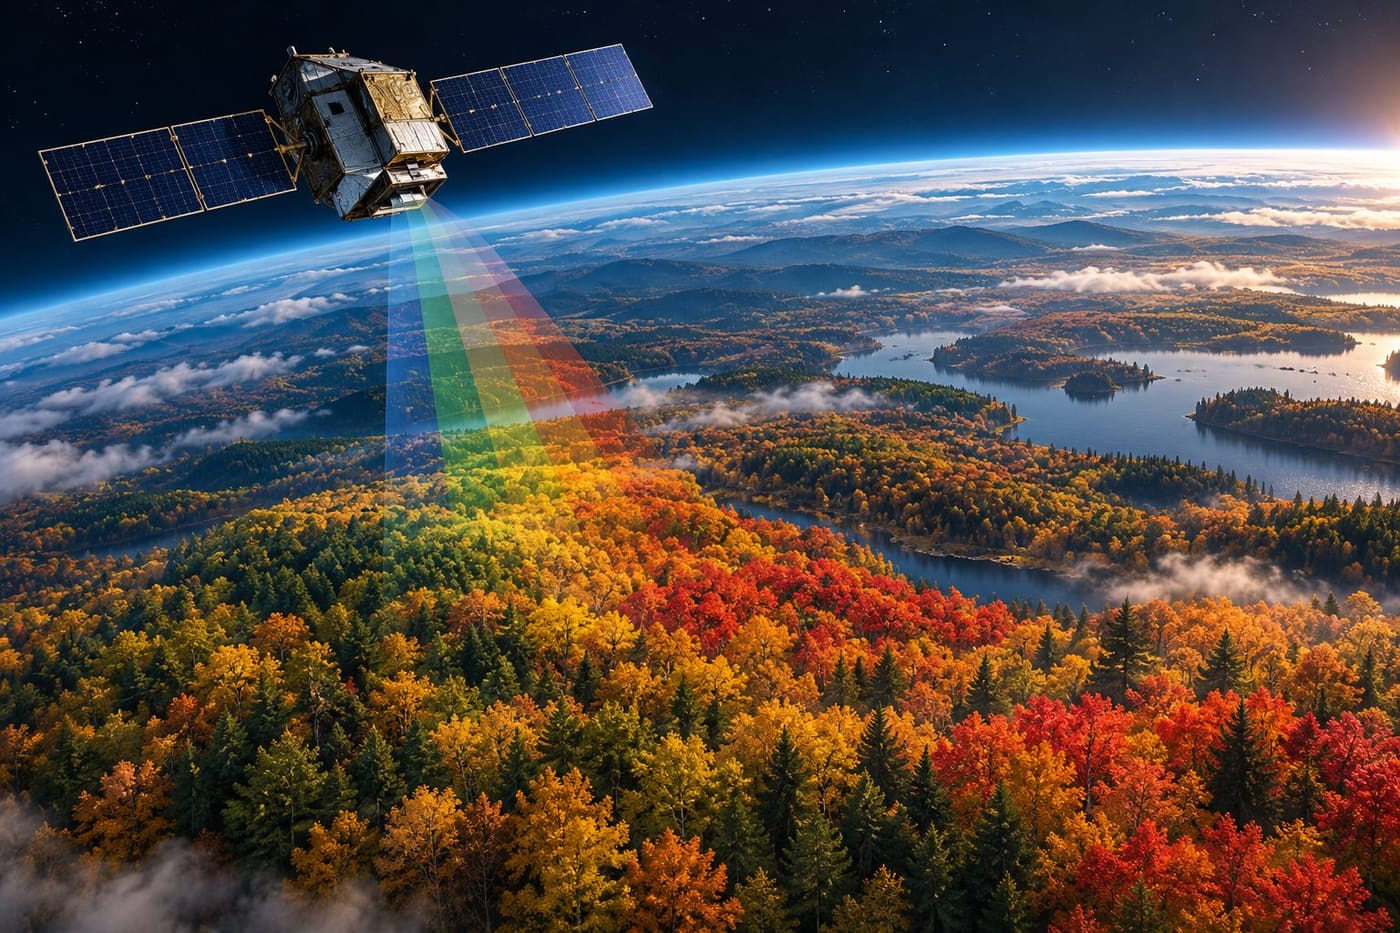
An autumn forest can look like a single wash of red from a roadside viewpoint. From orbit, it becomes a changing mixture of reflected light, plant pigments and land cover. That difference explains both the promise and the limitations of new satellite maps of seasonal colour. They can reveal patterns across enormous regions, but they cannot tell a visitor exactly how a particular trail will look this afternoon.
NASA’s Earth Observatory published a new account of this work on October 26, 2026. It describes how the Ocean Color Instrument aboard PACE is being used to follow changes in vegetation pigments. The examples include observations collected in late September and early October, rather than a live view of conditions on the publication date. That distinction matters when a colourful map begins circulating as travel advice.
This guide explains the measurements, the difference between a regional signal and a local view, and how observations made on the ground can help scientists interpret the result. Research was checked on October 27, 2026. The accompanying image is an original conceptual illustration, not a PACE observation or a scientific map.
What the new maps show
The [NASA Earth Observatory report](https://science.nasa.gov/earth/earth-observatory/hunting-red-leaves-with-satellites/) presents vegetation-colour maps for September 29–October 4 and October 5–11, 2026. NASA describes strong redness in northern regions during the earlier interval and a changing distribution farther south in the later one. The story also includes a Landsat 9 observation of the area around Ripton, Vermont, acquired on October 3.
The two types of imagery answer different questions. A broad colour map helps a reader see a regional pattern. A more detailed landscape image helps explain the terrain within a smaller area. Neither should automatically be treated as a photograph of the landscape today. Observation dates belong beside the interpretation, especially when the subject can change substantially over a short period.
The mapped colours also need a legend. A red area on a vegetation index is a visual representation of a measurement, not necessarily the shade someone would capture with a phone camera. Before sharing such a map, establish what quantity it represents, which dates it covers and whether any areas lack usable observations. Without that information, a scientifically useful graphic can become a misleading recommendation.
Why an ocean instrument can study forests
PACE stands for Plankton, Aerosol, Cloud, ocean Ecosystem. Its primary sensor, the Ocean Color Instrument, measures light across many closely spaced wavelength bands. Although ocean research is central to the mission, the same ability to distinguish spectral information also supports work on land vegetation and the atmosphere. NASA’s [instrument overview](https://pace.oceansciences.org/oci.cgi) explicitly describes these additional uses.
A familiar colour photograph combines broad information into the colours a viewer sees. An imaging spectrometer separates that information more finely. The useful question is not simply whether a surface looks green or red, but how much light is measured at particular wavelengths and how those measurements relate to one another. Scientists can use those relationships to investigate properties of the observed surface.
This is not a direct chemical test of every leaf. The instrument observes a signal from a piece of landscape. Interpreting that signal requires knowledge of the instrument, the atmosphere and the material on the ground. A forest canopy, a field and a patchwork of vegetation can produce observations that need different explanations, even if a display assigns them similar colours.
Three pigment groups behind the changing display
NASA’s autumn account focuses on chlorophylls, carotenoids and anthocyanins. Chlorophyll gives vegetation its familiar green appearance. Carotenoids contribute yellows and oranges, while anthocyanins contribute reds. As seasonal conditions change and chlorophyll declines, the balance of visible colour changes too. Satellite measurements let researchers follow aspects of that transition over large areas.
It is tempting to compress this into a simple rule: more red means autumn has arrived. The article itself gives reasons to resist that shortcut. Agricultural vegetation can show pigment changes associated with ageing or harvesting, and vegetation stress can also affect colour. The same broad signal therefore needs to be interpreted in the context of location, vegetation type and timing.
For a reader, the practical lesson is to distinguish an observation from its explanation. “The instrument detected a changing pigment-related signal” is one statement. “This area has reached the best day for viewing maple leaves” is a much more specific claim. Moving from the first to the second requires evidence that a regional satellite product alone may not supply.
Frequent observations reveal a sequence
A single image can show where a signal is strong. A sequence can reveal whether that signal is increasing, declining or shifting through a region. PACE’s frequent coverage is particularly valuable for this kind of seasonal study. NASA’s technical report on [hyperspectral terrestrial products](https://ntrs.nasa.gov/citations/20260001700) describes land observations on a one- to two-day timescale and a suite of vegetation indices.
That does not mean every location receives a perfectly clear, equally useful observation every day. Clouds and other observation conditions affect what can be interpreted. The distinction between potential coverage and usable information is important: a satellite may pass over a region while the view of the vegetation remains obstructed.
Consider an illustrative comparison between two wooded regions. One appears redder in a particular map, but its earlier observation may already have shown substantial colour. The other may be less red overall while changing quickly. Looking at the sequence gives a different understanding from ranking the two places using a single frame. This example explains the logic of time-series interpretation; it is not a finding about a particular destination.
A regional pixel is not an individual tree
The terrestrial-products report describes observations at approximately 1.2-kilometre spatial resolution. Product definitions and processing matter, so that figure should not be read as a universal specification for every PACE display. It nevertheless makes the essential point clear: these measurements describe landscape-scale areas, not the colour of one tree outside a house.
Within a landscape-scale observation, there may be trees, roads, lawns, water or fields. Their contributions can complicate the relationship between the displayed value and the scene a visitor encounters at ground level. An attractive stand of red trees can occupy only part of the area represented by a measurement. Conversely, a strong regional signal does not imply that every viewpoint is equally colourful.
This is why a broad satellite map and a recent local observation are complementary. One provides geographical context; the other provides detail about a specific place. For a walking route, access information and recent local photographs may be more immediately useful than a regional ranking. For a research question about seasonal patterns across a continent, the broad repeated coverage becomes much more valuable.
Read the dates before reading the colours
The October 26 NASA publication includes observations from earlier in the month. A reader who notices only the publication date could mistake the images for current conditions. This is a common problem with environmental imagery: the date of the article, the date of the observation and the period represented by a composite can all be different.
Before interpreting a foliage map, check:
- The acquisition date or the start and end dates of the observation interval.
- The geographical coverage and the size of the features the product can distinguish.
- The legend, including what the colours represent and how missing data are shown.
- Whether the publisher calls the product an observation, an index, a forecast or an illustration.
- Whether newer local information changes its usefulness for your intended decision.
A dated observation remains valuable after conditions change. Its purpose may be to document a season rather than guide tomorrow’s outing. The mistake is not using an older image; it is presenting an older image as if it answers a current question without qualification. Keeping the date visible protects both the science and the reader’s expectations.
Why ground photographs still matter
NASA’s report asks members of the public to contribute foliage observations through the GLOBE programme. The aim is to compare information collected from space with what people can see on the ground. A satellite has breadth; a local observer has context. Combining them can help researchers investigate whether the interpretation of an orbital signal fits the actual vegetation.
The [GLOBE Observer website](https://observer.globe.gov/en) directs participants toward landscape photographs using its Land Cover tool for the North American Phenology Campaign. Its [challenge listing](https://observer.globe.gov/do-globe-observer/challenges) places that campaign between August and December 2026. The same listing includes a separate PACE Clouds Challenge with different dates. Those are distinct activities, so readers should follow the instructions for the relevant campaign rather than combine them.
Useful participation begins with the current protocol. A photograph that looks impressive is not automatically the most useful scientific contribution. The location, timing and observation method provide context that a standalone image lacks. Following the programme’s instructions also makes contributions easier to compare, which is important when many people supply observations from different places.
Observation should not require a special trip
The NASA account explains that observations of shrubs, grasses, crops and other vegetation can be useful, not just spectacular forests. That broadens participation beyond people who live near a celebrated autumn destination. A familiar place can offer repeated observations and a better sense of how the scene has changed.
As a practical recommendation, choose an observation point you can reach safely and lawfully. Do not enter private land or step into traffic to reproduce a satellite view. Check the programme’s guidance before photographing a location, and avoid including identifiable people or sensitive information unnecessarily. These are ordinary observation precautions, not claims about additional campaign requirements.
A repeatable view is particularly useful for thinking about change. If the camera position, direction or lighting differs dramatically, visual comparisons become harder. Participants should follow the programme’s method rather than invent a private scoring system. Personal notes can help explain what was seen, but they should remain clearly separated from measurements made under an established protocol.
What this research may help answer
The researchers described by NASA are interested in more than finding an attractive weekend destination. Seasonal vegetation changes connect to questions about the timing of plant activity, carbon cycling and environmental stress. Repeated pigment observations may contribute to investigating these processes. The report also discusses research interests involving drought, insects, disease and wildfire risk.
Those interests should not be turned into claims that a public colour map can diagnose a diseased tree or predict a fire. A research direction is not the same as an operational service. To support a decision of that kind, a product would need appropriate validation, a stated purpose and evidence about its limitations in the relevant setting.
For example, an unusual colour pattern might justify closer investigation. It does not identify the cause by itself. A useful investigation could require local weather information, knowledge of vegetation and observations on the ground. The value of the satellite signal is that it helps frame a question across a large area; it does not eliminate the need to test competing explanations.
A sensible way to use the information
Start with the question you actually want answered. If you want to understand a regional seasonal pattern, compare dated maps and read the accompanying scientific explanation. If you want to visit a local trail, combine the regional context with recent local reports and access information. If you want to contribute to research, use the observation programme’s current instructions.
Avoid treating the brightest colour as a universal recommendation. The display may emphasise a particular pigment-related measurement, while your interest concerns a different aspect of the landscape. A mixed forest with several colours can be appealing without producing the strongest value in a redness index. Scientific importance and scenic preference are different judgments.
For anyone sharing the maps, a short accurate caption can prevent a great deal of confusion. State the observation interval, identify the instrument or product, link the original explanation and avoid adding a claim of live conditions. If the accompanying artwork is conceptual, label it as such rather than letting it resemble a documented observation.
Conclusion
PACE offers a way to follow changing vegetation through repeated measurements of light across large areas. Its autumn-colour work is valuable because it makes seasonal patterns visible at a scale that ground observers cannot cover alone. Ground observations remain essential for interpreting what those patterns mean.
The best reading of the maps begins with their dates, measurements and limitations. They are evidence about a changing landscape, not a guarantee about a particular tree, trail or travel day. Used alongside local knowledge and careful observation, they provide a richer view of autumn—and a useful lesson in how to read environmental information from space.
Sources and research note
Research date: October 27, 2026. Sources linked above are NASA and GLOBE primary material. NASA Earth Observatory and the NTRS abstract were retrieved directly. The GLOBE campaign listings were available through indexed official-page excerpts, while a direct request encountered a browser-verification screen. Check the current programme instructions before participating. Original conceptual illustration generated for this article; no satellite imagery is reproduced. The coloured bands in the illustration symbolise spectral measurement, not beams emitted by the spacecraft.