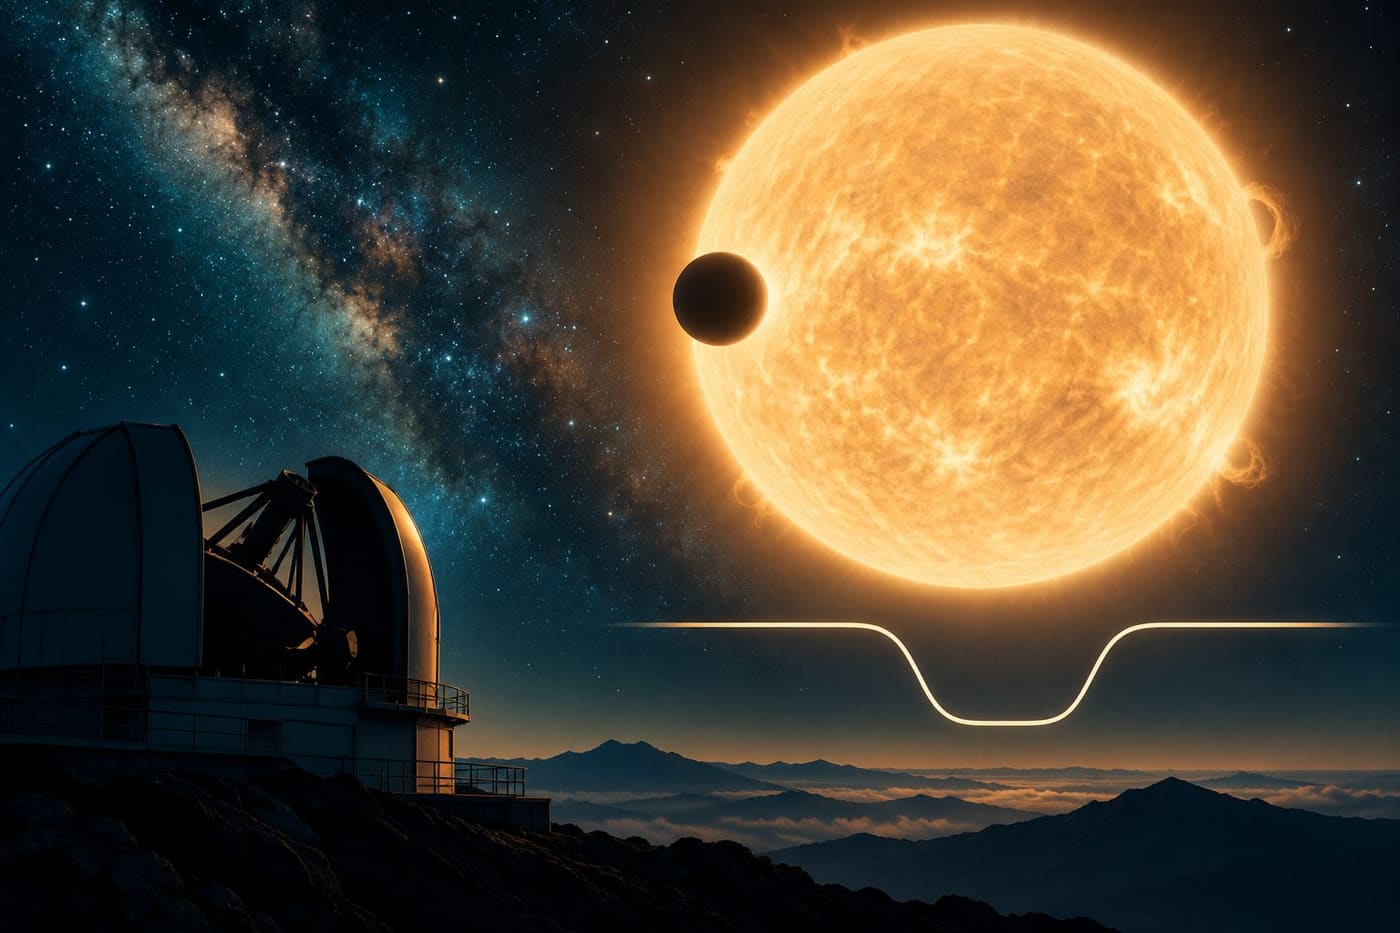
An announcement about a distant planet often arrives with a beautiful illustration. The illustration makes the story approachable, but the scientific result usually begins with something less familiar: a small change in starlight, a repeating pattern, or a measured shift in a spectrum. Understanding that evidence makes the discovery more interesting, because it reveals both the achievement and the questions that remain.
This guide explains a practical way to read exoplanet reporting using NASA and European Space Agency educational sources checked on October 28, 2026. It introduces detection, size, mass, and habitability as different questions. The worked examples are fictional learning exercises. They do not describe a newly announced planet, provide a current discovery count, or reproduce an actual telescope dataset.
Begin with what was measured
NASA describes two widely used detection approaches: transits and radial velocity. A transit can produce a small reduction in a star's observed brightness when a planet crosses its face from our viewpoint. Radial velocity examines changes in stellar light associated with the star's motion toward or away from the observer under an orbiting planet's gravitational influence. Source: https://science.nasa.gov/exoplanets/facts/
Those measurements are different from a close-up photograph of a planetary landscape. When reading an announcement, identify the observable first. Was the team measuring brightness, spectral changes, or something else? Then ask how the observation supports the planet interpretation. This sequence prevents the accompanying artwork from becoming an imagined observation in the reader's memory.
A useful note has three parts: the recorded signal, the interpretation, and the remaining uncertainty. For example, a fictional exercise might supply repeated brightness dips and an interpretation involving an orbiting object. It would not automatically supply mountains, oceans, or clouds. Those additions would require their own evidence or an explicit label identifying them as artistic possibilities.
Understand a light curve's axes
A light curve plots observed light against time. NASA's transit explainer describes the characteristic dip caused by a planet passing in front of its star. It explains that transit information can help determine characteristics such as orbital period and planet size. The measurement is therefore useful even when the planet is not individually resolved in an image. Source: https://science.nasa.gov/exoplanets/whats-a-transit/
Before interpreting a published graph, inspect the labels. Is brightness shown as an absolute value, a relative quantity, or a normalized value? Is time measured in hours, days, or an offset from an event? A narrow displayed vertical range can make a small physical variation look visually large. Read the scale rather than judging the dip by its height on the page.
In a fictional classroom plot, the baseline is normalized to one and the dip reaches 0.99. The relative reduction in that simplified example is one percent. A second plot could show the same data with a much tighter vertical range and make the dip appear deeper on the page. Changing the display does not change the underlying observation.
Repetition gives a pattern a timeline
ESA explains that transits repeat with the planet's orbital timing, provided the viewing geometry allows them to be seen. That geometry matters: a planet can exist without crossing its star from our particular line of sight. The absence of an observed transit is therefore not a general demonstration that no planet orbits a star. Source: https://www.esa.int/Science_Exploration/Space_Science/Exoplanets/How_to_find_an_exoplanet
Suppose an exercise shows dips on day two, day seven, and day twelve. The intervals in the supplied example are five days. That supports a proposed repeating schedule to investigate. It does not by itself settle every possible explanation for the dips or reveal what happens on the planet's surface.
Write down the observed intervals before extending the pattern. Predicting another event at day seventeen is a testable expectation in this exercise. It should be labeled a prediction until an observation is provided. Separating recorded events from predicted ones is useful in many scientific subjects, especially when a chart contains both measurements and a fitted curve.
Radial velocity asks a different question
The radial-velocity method follows the star's motion along the observer's line of sight through changes in its light spectrum. NASA provides a dedicated educational resource illustrating this detection method. It is a complementary route to investigating an orbiting planet, rather than another name for measuring the brightness dip during a transit. Source: https://science.nasa.gov/resource/exoplanet-detection-radial-velocity-method/
For a reading exercise, place two imaginary graphs beside one another. One shows brightness against time; the other shows a velocity-related measurement against time. Label them before comparing their patterns. Similar-looking curves can represent different physical quantities, and treating them as interchangeable would erase the reason that combining observations is valuable.
Avoid converting a simplified classroom wave into an exact claim about a real system. Real measurements require an analysis appropriate to the star, instrument, observing schedule, and competing explanations. The educational point is that independent kinds of evidence can constrain different parts of an interpretation. It is not that any smooth repeating curve must represent a planet.
Size and mass should have separate entries
ESA describes Cheops as a mission studying bright stars already known to host planets, making precise observations of planetary size during transits. Its characterization work helps derive bulk density when size information is combined with the necessary mass information. This is a useful example of why discovering a planet and characterizing it are related but distinct activities. Source: https://www.esa.int/Science_Exploration/Space_Science/Cheops
In your notes, make separate fields for radius, mass, and the method or source supporting each. If a report supplies only a radius estimate, leave mass unresolved rather than guessing from a familiar Solar System comparison. A world described as larger than Earth is not thereby described as having Earth's composition, atmosphere, or surface conditions.
Words such as “bigger” can hide this distinction. Ask whether the writer means radius, diameter, volume, or mass. If the original source uses a precise quantity, retain it in your summary. Replacing every quantity with a dramatic size comparison may make the prose shorter while making the science harder to understand.
A density exercise shows why precision matters
Consider a deliberately simplified exercise with two hypothetical spherical objects. They have the same mass, but one has twice the radius of the other. Using the sphere-volume relationship, doubling radius increases volume by a factor of eight. With equal mass spread over eight times the volume, the larger object's average density is one-eighth that of the smaller one.
This arithmetic is a teaching example, not a model of a named exoplanet. Its value is to show why radius and mass cannot be swapped in a headline. A statement about twice the radius has very different implications from a statement about twice the mass. Keeping units and definitions visible protects the meaning of the result.
Even an average density would not amount to a complete interior map. A bulk property summarizes the object; it does not hand the reader a photograph of its internal layers. When a scientific team discusses possible composition, read whether it presents one interpretation, several compatible models, or a stronger conclusion supported by additional information.
Keep candidate status visible
A headline may introduce an object as a candidate while a later sentence casually calls it a planet. Preserve the status used by the underlying scientific work. NASA's general exoplanet information distinguishes candidates from confirmed planets and notes that some candidate signals can turn out to be false positives. Source: https://science.nasa.gov/exoplanets/facts/
For a fictional worksheet, mark Object A as “candidate in the supplied material” and Object B as “confirmed in the supplied material.” Do not erase that difference because both have interesting illustrations. The status is information about the strength and stage of the interpretation, and it deserves to travel with the claim when the story is shared.
If two sources use different labels, compare their dates and scope. One might describe an earlier stage, or use a term differently. Record the discrepancy rather than automatically choosing the more exciting wording. Where you cannot resolve it, a short uncertainty note is more accurate than silently upgrading the object's status.
Habitable-zone language needs context
NASA describes the habitable zone as a range of distances where conditions could allow surface liquid water, depending on the star and planetary circumstances. Location in that zone is a starting point for investigation, not an observation of water or life. A NASA discussion of star–planet interactions explicitly notes that being in the zone does not necessarily mean a planet is habitable. Sources: https://science.nasa.gov/exoplanets/habitable-zone/ and https://www.nasa.gov/solar-system/spanning-disciplines-in-the-search-for-life-beyond-earth/
A useful editing exercise is to compare three sentences: “The object is described as lying in its star's habitable zone,” “the object has liquid water,” and “the object supports life.” Each is a different claim. The first does not automatically establish the second or third. Ask what observation or analysis supports each step before repeating it.
Likewise, “Earth-sized” should not become “another Earth” without explanation. A size comparison supplies a specific resemblance, not a complete environmental description. Careful wording can still convey excitement: identifying a promising target for further work is a substantial achievement without treating every unknown property as favourable.
Read the illustration's caption
Artwork is valuable when its role is clear. It can show a proposed arrangement, communicate scale, or help readers imagine a system. Check whether the caption identifies an artist's impression, a schematic, a simulation, or actual observational data. Those labels tell you how the image relates to the scientific result.
In this article's conceptual illustration, a stylized star and planet are educational symbols. Their colours and surface appearance are design choices. They should not be read as measurements of an actual world's clouds, geology, or temperature. A polished rendering can look convincing while communicating no observational evidence about those details.
When sharing a picture, retain the explanatory caption. Removing “artist's impression” can change how another reader understands the same image. If a publication does not clearly label what the image represents, avoid using it as evidence for claims about what a distant planet actually looks like.
Make a discovery-reading worksheet
Start with the source title, publication date, object name, and research status. Add the detection method, measured quantities, reported uncertainties, and the exact claim you want to explain. Keep the original links so that your notes can be checked. A short worksheet is often enough to expose where a headline has compressed several distinct findings.
Use a final column for unanswered questions. Examples include whether a mass estimate is supplied, what supports a composition interpretation, or whether a statement about atmosphere comes from measurement or modeling. An unanswered question is not a flaw in the science. It becomes a problem only when the summary pretends it has already been answered.
For another example of tracing a scientific claim back to its measurement, see our article on NASA's PACE satellite and autumn colour here: https://monetizearticle.com/article/how-nasa-s-pace-satellite-reads-autumn-colour-and-what-the-maps-cannot-tell-you-16fd26. The subject differs, but the same habit applies: distinguish the instrument's observations from the broader environmental conclusions a reader might be tempted to infer.
A worked summary without inflated claims
Imagine that an exercise supplies repeating brightness dips, a radius estimate, and a candidate label. A disciplined summary might read: “The supplied observations show a repeating brightness pattern interpreted as a transiting planet candidate, with an estimated radius. The exercise provides no mass measurement, atmospheric result, or evidence of life.” This captures both the finding and its boundary.
Now imagine a second exercise adds an independently supported mass estimate. You can expand the summary to describe the additional characterization, preserving its uncertainty. The new information improves the account without requiring you to rewrite earlier uncertainty as if it had never existed. Science reporting benefits from keeping that progression visible.
The test is simple: underline each factual claim in your summary and identify its supporting observation or source. If a phrase comes only from an illustration, a familiar analogy, or your imagination, label it appropriately or remove it. The resulting paragraph may be less dramatic, but it will be easier for another reader to trust and examine.
Conclusion
Exoplanet discoveries become clearer when the reading order begins with the signal. Identify what was measured, how the interpretation was reached, which properties have estimates, and what remains open. Preserve candidate status, units, uncertainties, and image labels when turning a technical announcement into a short explanation.
The excitement lies in learning how astronomers extract information from distant starlight. A small dip or spectral change can open a serious investigation of another world. Understanding the boundaries of that information makes the achievement more meaningful and gives the next observation a clear purpose.
Sources and research note
Research date: October 28, 2026. Linked NASA and ESA educational pages support the explanations of detection, characterization, and habitability. No current confirmed-planet count or new discovery is asserted. All numerical examples and named worksheet objects are fictional exercises; the density example assumes ideal spheres. The original AI-generated conceptual illustration represents a generic star–planet system and is not telescope imagery or a reconstruction of a named world.