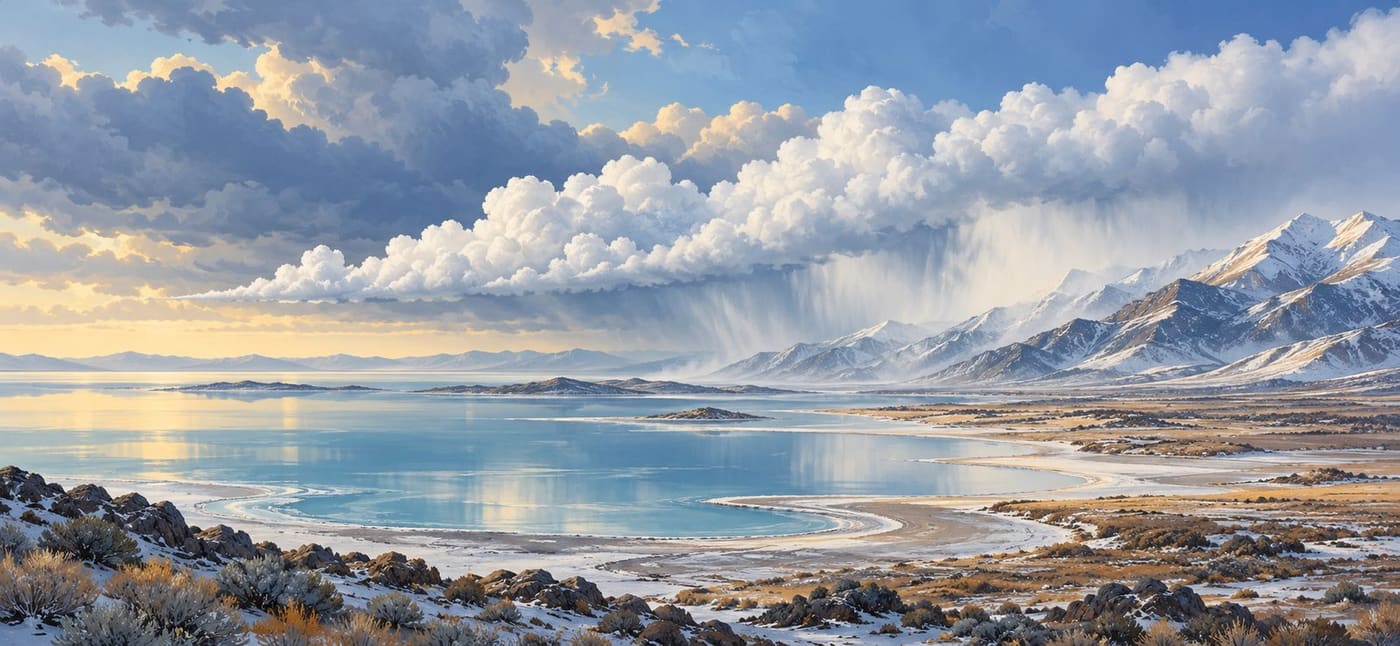
A search for Salt Lake City weather can lead to forecasts for the airport, nearby neighborhoods and mountain destinations that look surprisingly different. One reason to look beyond the city name is the Great Salt Lake itself. Under suitable conditions, the lake helps organize clouds and precipitation downwind. Nearby mountains add another influence, so a single regional weather headline cannot explain every local snowfall report.
This is a science guide to that process, researched on 25 October 2026. It is not a forecast of snow today or a claim that the latest weather system will produce lake-effect snow. The useful question is how to recognize the ingredients, understand the evidence and avoid reading more into a map than it actually says.
Start with an actual event, not a dramatic assumption
On 17 April 2026, the University of Wisconsin's Cooperative Institute for Meteorological Satellite Studies documented a cloud plume over the southern part of the Great Salt Lake. Satellite imagery showed fresh snow southeast of the lake after sunrise. The case illustrates that lake effect can produce a relatively modest, localized result, rather than always delivering an exceptional storm.
The analysis used different satellite products to separate clouds from new snow cover. In one enhanced-color product, clouds appeared white while fresh snow appeared red. Those colors were a method of displaying information, not the colors someone would have seen standing outside. [CIMSS case study](https://cimss.ssec.wisc.edu/satellite-blog/archives/69974).
For a reader, the date and product label are essential parts of that evidence. An April satellite image can explain a mechanism in October, but it cannot establish October conditions. Equally, a narrow visible snow swath does not tell us how much snow fell at every address within it. Keep the observation, its interpretation and any later prediction separate.
What the lake contributes
NOAA describes the basic lake-effect process as cold air passing over warmer water, receiving heat and moisture, and developing rising air that can form clouds. With an appropriate temperature contrast and atmospheric conditions, precipitation can fall downwind. The wind helps determine where the resulting cloud structures travel. [NOAA lake-effect explanation](https://www.nesdis.noaa.gov/our-environment/ice-snow/lake-effect-snow).
That description is a starting point, not a recipe that guarantees snow whenever water is warmer than air. Think of the lake as one contributor to an atmospheric system. A weather report that mentions a favorable ingredient has not necessarily announced the finished outcome.
When reading a forecast discussion, ask what role the writer gives the lake. Is it expected to help initiate showers? Enhance precipitation already associated with a larger weather system? Or is lake effect merely listed as a possibility? Those statements carry different levels of commitment. Preserve the forecaster's wording when sharing the information with someone else.
For example, the fictional sentence "a band could develop late tonight" should not become "the city will receive heavy snow tonight." The second version adds certainty, intensity and geographic coverage that the first never supplied.
Why this salt lake is a distinctive setting
University of Utah educational material explains that the lake occupies a broad, relatively flat basin. Changes in water level can therefore move the shoreline substantially. Wet and dry periods also change salinity: incoming fresh water dilutes salts, while evaporation removes water and leaves salts behind. [University of Utah physical characteristics](https://learn.genetics.utah.edu/content/gsl/physical_char/).
The practical implication for a science reader is that a lake outline is not necessarily permanent. Before comparing two diagrams, check whether they represent the same year or water level. A generic illustration can explain a concept without being an accurate map of the present shoreline. A scientific analysis making claims about lake size needs a dated measurement instead.
A historical University of Utah research overview adds several important qualifications. Salinity suppresses freezing over much of the lake but also reduces saturation vapor pressure and latent heat exchange. The shallow water can change temperature quickly. Lake-effect precipitation may appear as irregular showers, a distinct band or broader coverage, and may coexist with larger-scale and mountain-driven precipitation. [Historical lake-effect research overview](https://www.inscc.utah.edu/~u0028395/lake_diagnostics/).
These findings warn against treating every lake as interchangeable. They also do not justify describing old forecasting equipment, model performance or observation networks on that research page as the current operational system. Scientific explanations and operational inventories have different shelf lives.
Mountains can add another mechanism
NASA explains that air moving up mountains cools and can produce enhanced precipitation. Terrain also creates small-scale variability that is difficult to measure: gauges may be sparse, and radar observations can be affected by blockage and ground clutter. [NASA explanation of mountainous precipitation](https://gpm.nasa.gov/resources/faq/what-effect-do-mountainous-orographic-regions-have-measuring-precipitation).
The Utah Geological Survey connects this geography specifically to the Great Salt Lake, the Wasatch Front and the Oquirrh Mountains. Its overview describes lake enhancement after cold fronts and further enhancement as air rises over terrain. [Utah Geological Survey questions and answers](https://geology.utah.gov/popular/great-salt-lake/commonly-asked-questions/).
This is why asking whether a storm is "lake effect or mountain snow" can be too restrictive. More than one process can contribute. Without a detailed analysis, a large mountain total should not be assigned entirely to lake evaporation, nor should a small valley total be used to dismiss the importance of the lake elsewhere.
Imagine two fictional reports: a resident describes a light coating on a neighborhood lawn, while a mountain observer reports a deeper accumulation. Those reports need not contradict each other. Before looking for an error, compare location, elevation, observation time and the period each total covers. The task is to make the reports comparable before trying to explain their difference.
Read a snow map in a deliberate order
The first pass should be about the map's definition, not its most striking color. A useful sequence is:
- Identify the issuing organization and publication time.
- Read the beginning and end of the forecast period.
- Check the units and what variable is displayed.
- Locate the specific destination or area you care about.
- Read the legend, uncertainty wording and accompanying explanation.
This sequence prevents several ordinary mistakes. A map of snowfall is different from a map of liquid-equivalent precipitation. A forecast for an entire multi-day period is different from an hourly forecast. A map copied into a social post may also have lost the caption that made its meaning clear.
The National Weather Service's digital definitions distinguish snow accumulation, snow level and the snow-to-liquid ratio. Snow level describes the lowest elevation at which precipitation is expected to be snow for the stated hour; snow-to-liquid ratio compares accumulated snow with its melted equivalent. [NWS forecast definitions](https://digital.weather.gov/staticpages/definitions.php).
For an illustrative comparison, suppose one graphic covers a fictional Monday and another covers Monday through Wednesday. A larger number on the second map does not establish that the forecast became more severe. The period changed. First find comparable windows; then ask whether the forecast changed.
A high-end scenario is not the expected total
The National Weather Service uses probabilistic snowfall products to communicate a range of possibilities. Its explanatory material distinguishes the official expected forecast from a high-end amount with a 10 percent chance of being exceeded and a low-end amount with a 90 percent chance of being exceeded. These labels are planning information, not competing promises about what will happen. [NWS explanation of snowfall probabilities](https://www.weather.gov/pub/winter).
If a fictional graphic has an expected amount of two inches and a high-end amount of six, posting only "six inches forecast" removes the distinction that made the graphic useful. A more faithful description would preserve both values and their labels. This example is invented to explain reading practice; neither number is a forecast for Salt Lake City.
It is also worth checking which probability question a product answers. "Chance of exceeding a threshold" is not the same wording as "expected amount." Do not combine the most alarming number from one product with a probability taken from another. Keep the place, period, threshold and probability together when making notes.
Build a small evidence record
For someone following a possible lake-effect event, a short record is more useful than a folder full of unlabeled screenshots. Use one row per item and write down:
- The source and direct link.
- The issue time and valid period.
- The location or area described.
- Whether it is an observation, forecast or explanatory background.
- The claim it supports, including any qualification.
Consider a fictional evening update followed by a morning observation. The evening item says a band might affect part of the valley. The morning item reports snow at one station. Together they show a forecast possibility and a later local observation. They do not, by themselves, establish the full band footprint or prove every part of the earlier forecast correct.
That distinction matters when discussing forecast accuracy. A fair assessment needs the original forecast as issued, the relevant verification period and observations appropriate to its geographic scale. Retelling the prediction after seeing the outcome is a poor substitute for preserving it.
This record also makes corrections easier. If an image turns out to be from a previous season, remove it from the current-event evidence while retaining it, properly labeled, as an educational example. The correction should change the claim, not merely add a small date beneath a misleading headline.
What changing lake levels can and cannot tell you
Utah's Division of Water Resources describes the lake's sensitivity to wet and dry periods and the connection between mountain snowmelt and lake levels. The water system therefore includes movement in both directions: lake conditions influence aspects of local weather, and precipitation in the wider basin helps replenish the lake. [Utah Division of Water Resources overview](https://water.utah.gov/great-salt-lake/).
It is tempting to turn that relationship into a simple rule for an individual storm. Avoid doing so without event-specific evidence. A shoreline photograph is not a calculation of tomorrow's snowfall. Nor does one snowy day settle a long-term question about the lake's condition.
When evaluating an environmental claim, ask whether it concerns a single weather event, a season or a long-term trend. Then look for measurements and analysis at the same scale. An article about lake preservation may provide important context without serving as a local forecast; a daily forecast may be excellent for its purpose without resolving the lake's long-term water balance.
Questions worth asking before sharing a weather headline
An effective headline should tell readers what is known without turning possibility into certainty. Before forwarding one about Great Salt Lake snow, check four things.
First, is the story explaining lake effect or announcing an actual forecast? An evergreen science article can remain useful long after its publication date, but its illustrations and historical cases should not be mistaken for current observations.
Second, does "Salt Lake City" mean a particular point, the urban area or a broader region that includes mountains? If the story leaves that unclear, follow its source link before applying the claim to a personal location.
Third, is a dramatic total presented as observed, expected or possible? These are different statements. Preserve the category when discussing the number, along with the time period and location.
Fourth, does the evidence establish the mechanism? Snow near the lake is not enough, on its own, for a reader to diagnose lake effect. Prefer an explicit meteorological assessment over a guess based on proximity.
For current information, start with the [National Weather Service Salt Lake City office](https://www.weather.gov/slc/), then select the relevant local forecast and read its current details. This article deliberately does not reproduce a live forecast that could become stale shortly after publication.
Conclusion: keep the process and the prediction separate
The Great Salt Lake offers a clear example of weather shaped by interacting features: water, air flow and surrounding terrain. Understanding those connections helps explain why nearby reports can differ and why a regional headline needs local detail.
The strongest reading habit is simple: identify the product, location and time before interpreting its message. Use historical cases to understand the process, current forecasts to understand stated possibilities, and observations to establish what happened. Keeping those roles separate produces a more accurate account than choosing the biggest number or the most dramatic image.
Research date: 25 October 2026. The April case is historical; all hypothetical scenarios are labeled. The cover is an original AI-generated conceptual illustration, not a satellite product, measured map or photograph of a documented storm. This AI-assisted article includes original editorial explanation and source links; limited web-search similarity review is not comprehensive plagiarism certification.